On the 22nd and 23rd of February, the Law Factory Team (Centre d’études européennes de Sciences Po, Médialab Sciences Po and Regards Citoyens) organized an open design process in the form of a « Design Camp ». The camp consisted of a 2-days workshop in Sciences Po Paris aiming to find a design agency/team or collaboration between different agencies/teams able to design and develop the data visualization interfaces of our project.
Two teams participated at the “Design Camp”: Manufactura Independente (Porto, Portugal), represented by Ricardo Lafuente and Ana Carvalho, and Density Design Lab (Politecnico Milano, Italy), represented by Paolo Ciuccarelli, Matteo Azzi, Donato Ricci, and Benedetta Signaroldi.
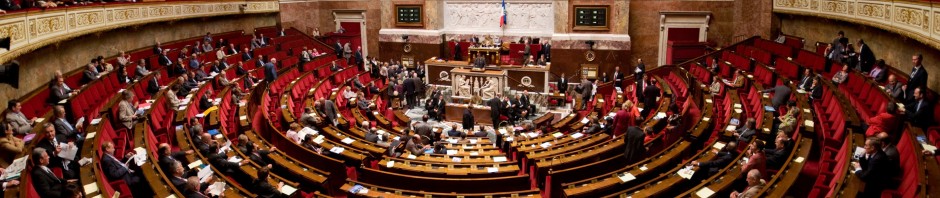
The morning of the first day of the workshop started with a presentation of the participants and of the Law Factory project.
The research project “The Law Factory” aims at using different software and informatics tools to question the generalized impotence of the Parliament. Those tools are corroborated by a number of case studies, namely from the legal and political science area. By systematically exploiting large public databases related to parliamentary activities, these instruments offer a unique resource of visualization, understanding and analysis of parliamentary debates. The project includes a focus on those areas of legislation that have been changed as a result of parliamentary amendments. It aims at offering an intelligent visualization that allows quantitative but also qualitative analysis of parliamentary activity.
Several projects of data visualization were presented, starting with those proposed by the Assemblée Nationale and improved by citizens and continuing with examples of visualization of amendments proposed by Le Monde or with the presentation of matching diffs on amendments compared to lobbyists texts (LobbyPlag). Similar examples from other countries, like the US or Germany were discussed.
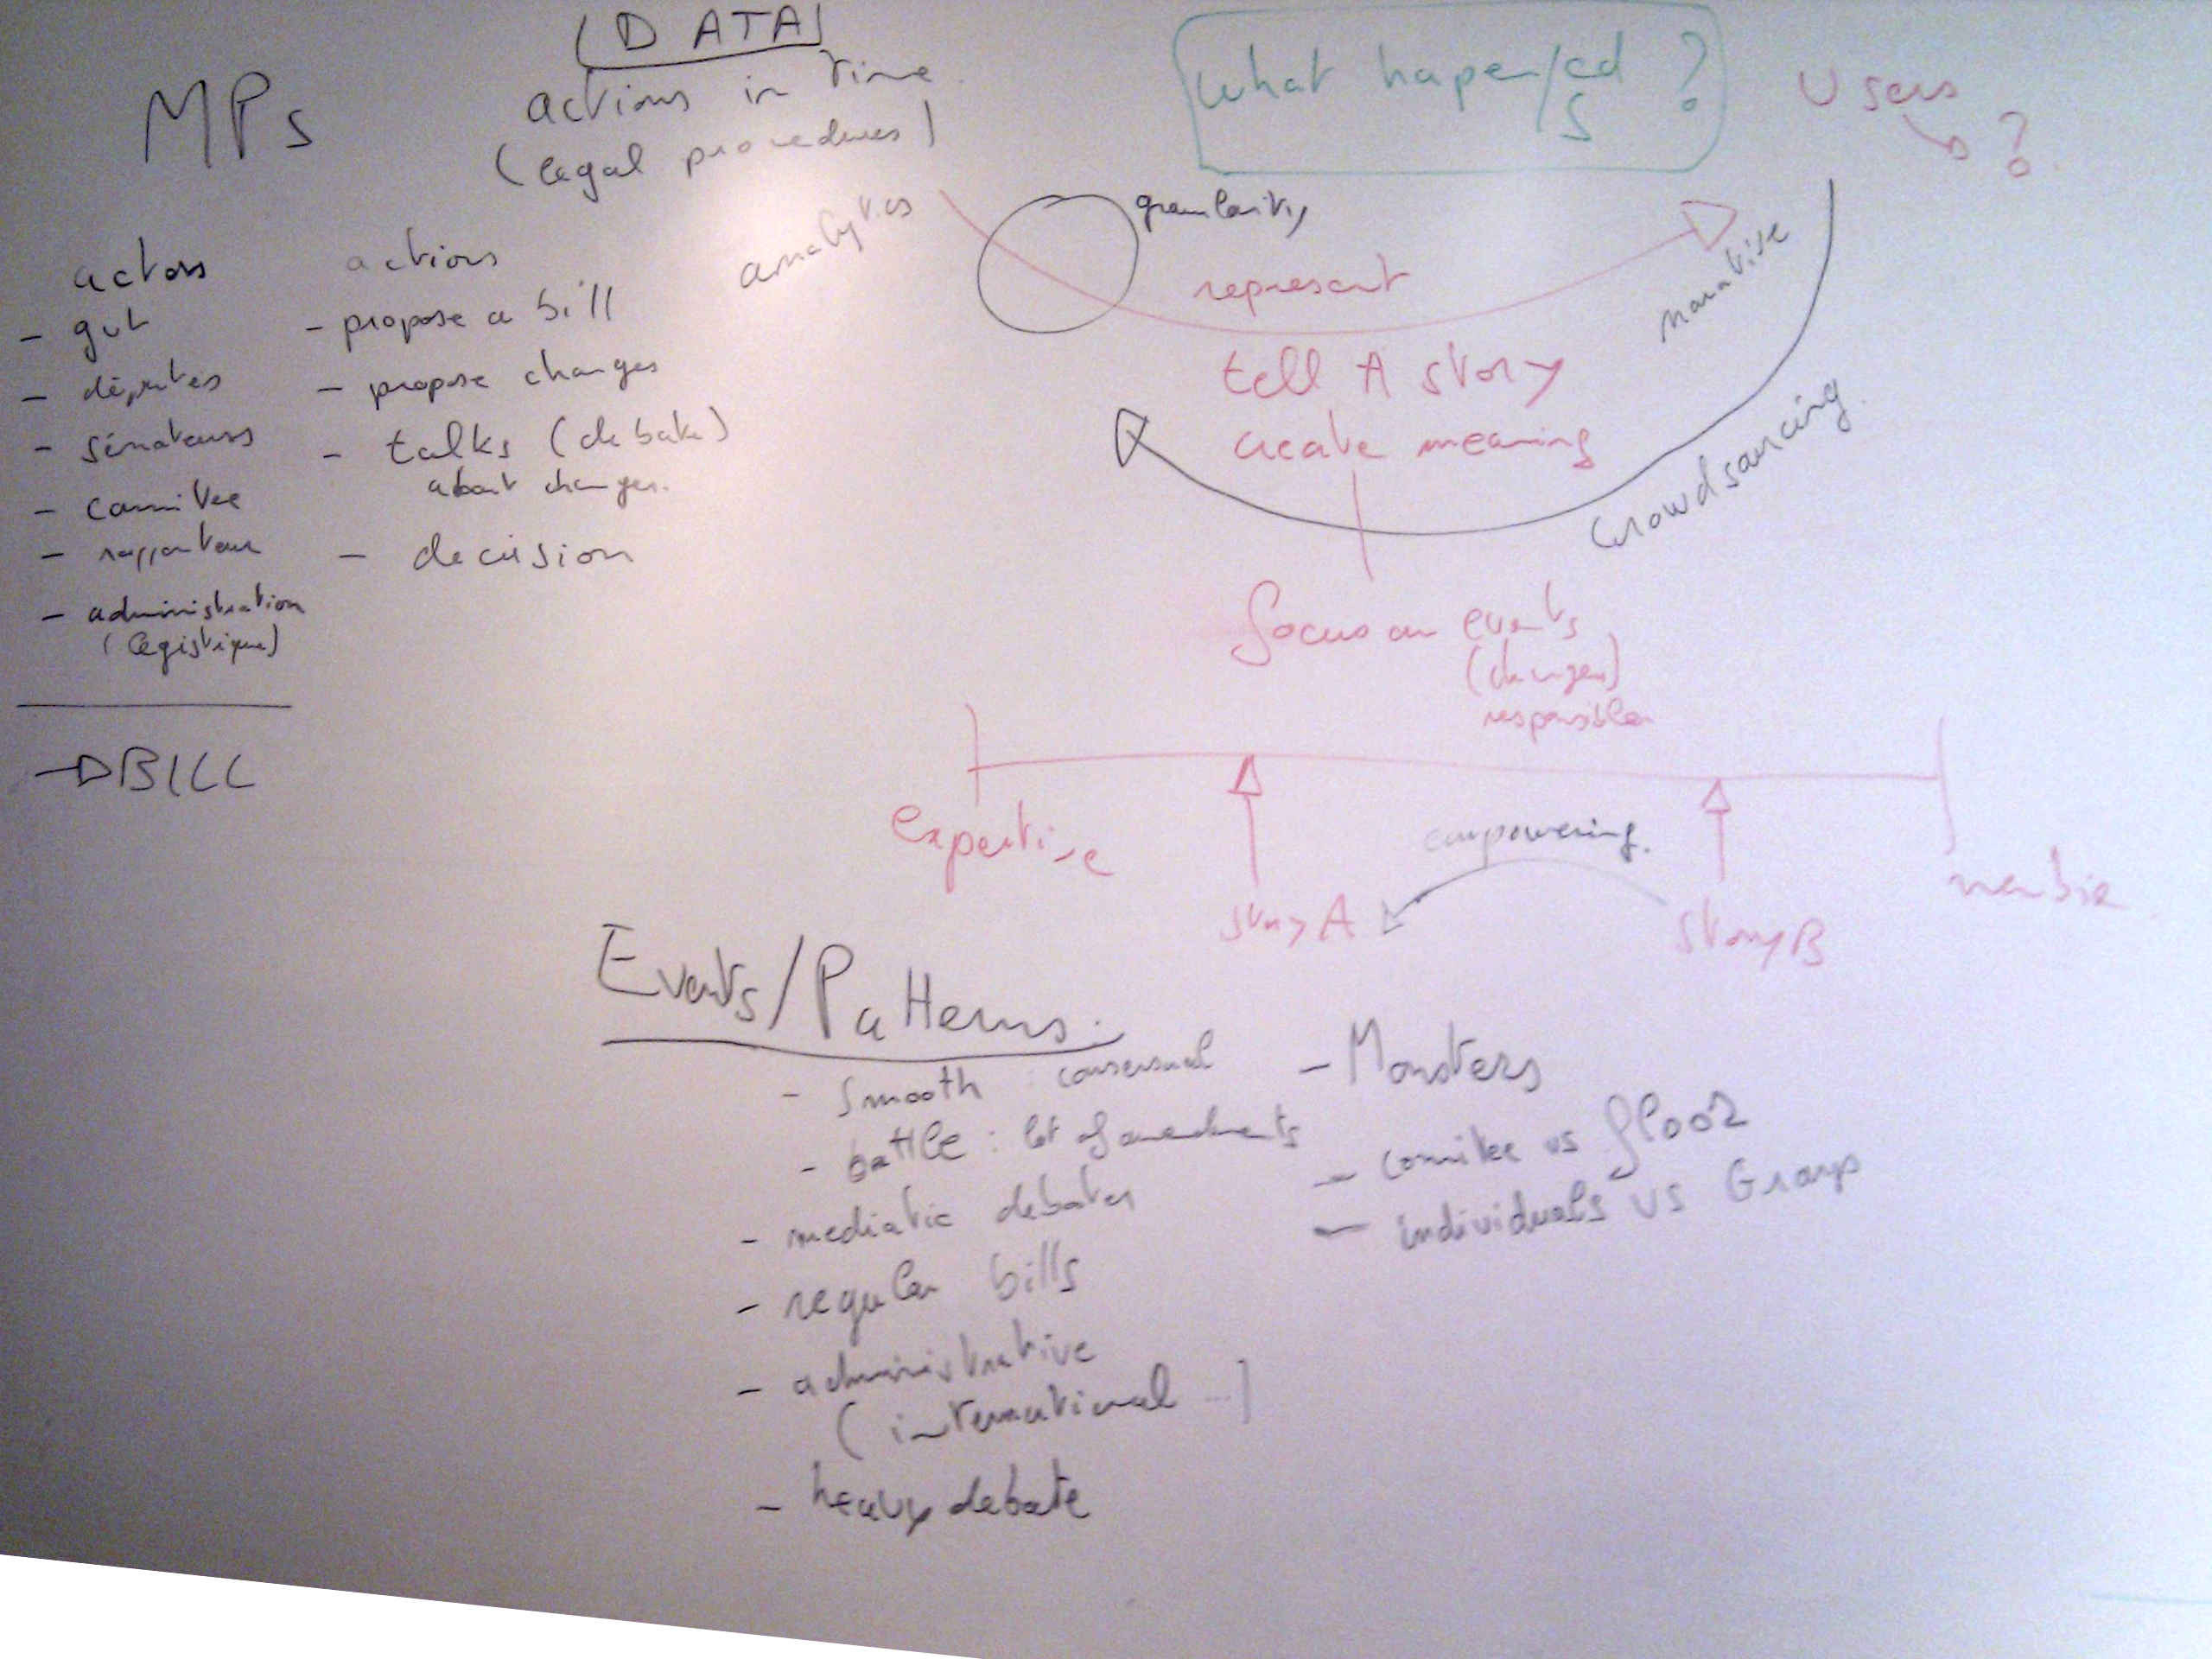
The afternoon was dedicated to a brainstorming session aiming to find the most important aspects both from a technical point of view (type of data, type of interfaces, data source) and from a political research point of view (public target, process tracing, patterns of action, level of granularity).
On the one hand, our data visualization targets mainly an expert public (political sciences researchers, parliament’s geeks, journalists, lawyers, MPs and their staff or interested citizens) without necessary excluding ordinary citizens. Consequently, a more analytical and interactive interface is privileged to a more native and path driven one. This interface is not meant to represent all the information included in the dataset, but to focus on the important aspects and to prioritize the available information focusing on the changes faced by the law in the parliamentary stage and on the “hot moments” of the law during its parliamentary phase. Thus, the interface is meant to tell the story of bills in the French Parliament. In the same time it seeks to make the story of the laws “sexy” for the public, by making the bill understandable by using information, data source and comparing its different versions, but also by presenting the interactions and events that generated the bill- interventions, amendments etc.
Starting from these ideas the second day was dedicated to the working groups. Two groups were formed: the first one by Matteo Azzi, Ana Carvalho, Tangui Morlier, Paul Girard, Benedetta Signaroldi and Angela Tacea approached the data from a bottom-up perspective and presented the availability of the data on the text, on the floor and in the committees. Data on the text is easily accessible and comparisons between diffs can be built without difficulties. However, the committee stage is a black box for computers due to the fact that amendments are not available in an exploitable format. Still, committee data offers a complete perspective on: talks, attendance, number of amendments and length of discussion.
The data on the floor is complete and all the information is available and exploitable: attendance, amendments, talks (general discussion, discussion related to amendments and « rappel au réglement ». Thus, discussions on floor can be viewed as theater plays, each amendments discussion being a scene. Analyzing those theater plays following the work done by the Literary lab in Stanford could be a interesting representation mode.
More generally, two metaphors can describe the parliamentary stage of the law:
- the race metaphor- where the focus is on the time span
- the line of production metaphor- where the focus is on the contribution of each stage to the final version of the law
The second working group formed by Christophe Boutet, Paolo Ciuccarelli, Ricardo Lafuente, Benjamin Ooghe-Tabanou, Donato Ricci, Olivier Rozenberg and Laurent Guerby adopted a top down perspective starting from the research questions with the aim of drawing an ideal type of data visualization.
The two groups gathered during the afternoon with the aim of combining the two perspectives and propose the optimal data visualization. Several types of actors can be identified:
- government member
- National Assembly MPs, group of MPs
- Senate MPs, group of MPs
- committees members, committees, committee rapporteur,
- National Assembly, Senate,
- legistics service of the Senate, legistics service of the National Assembly
and they act following the scheme:
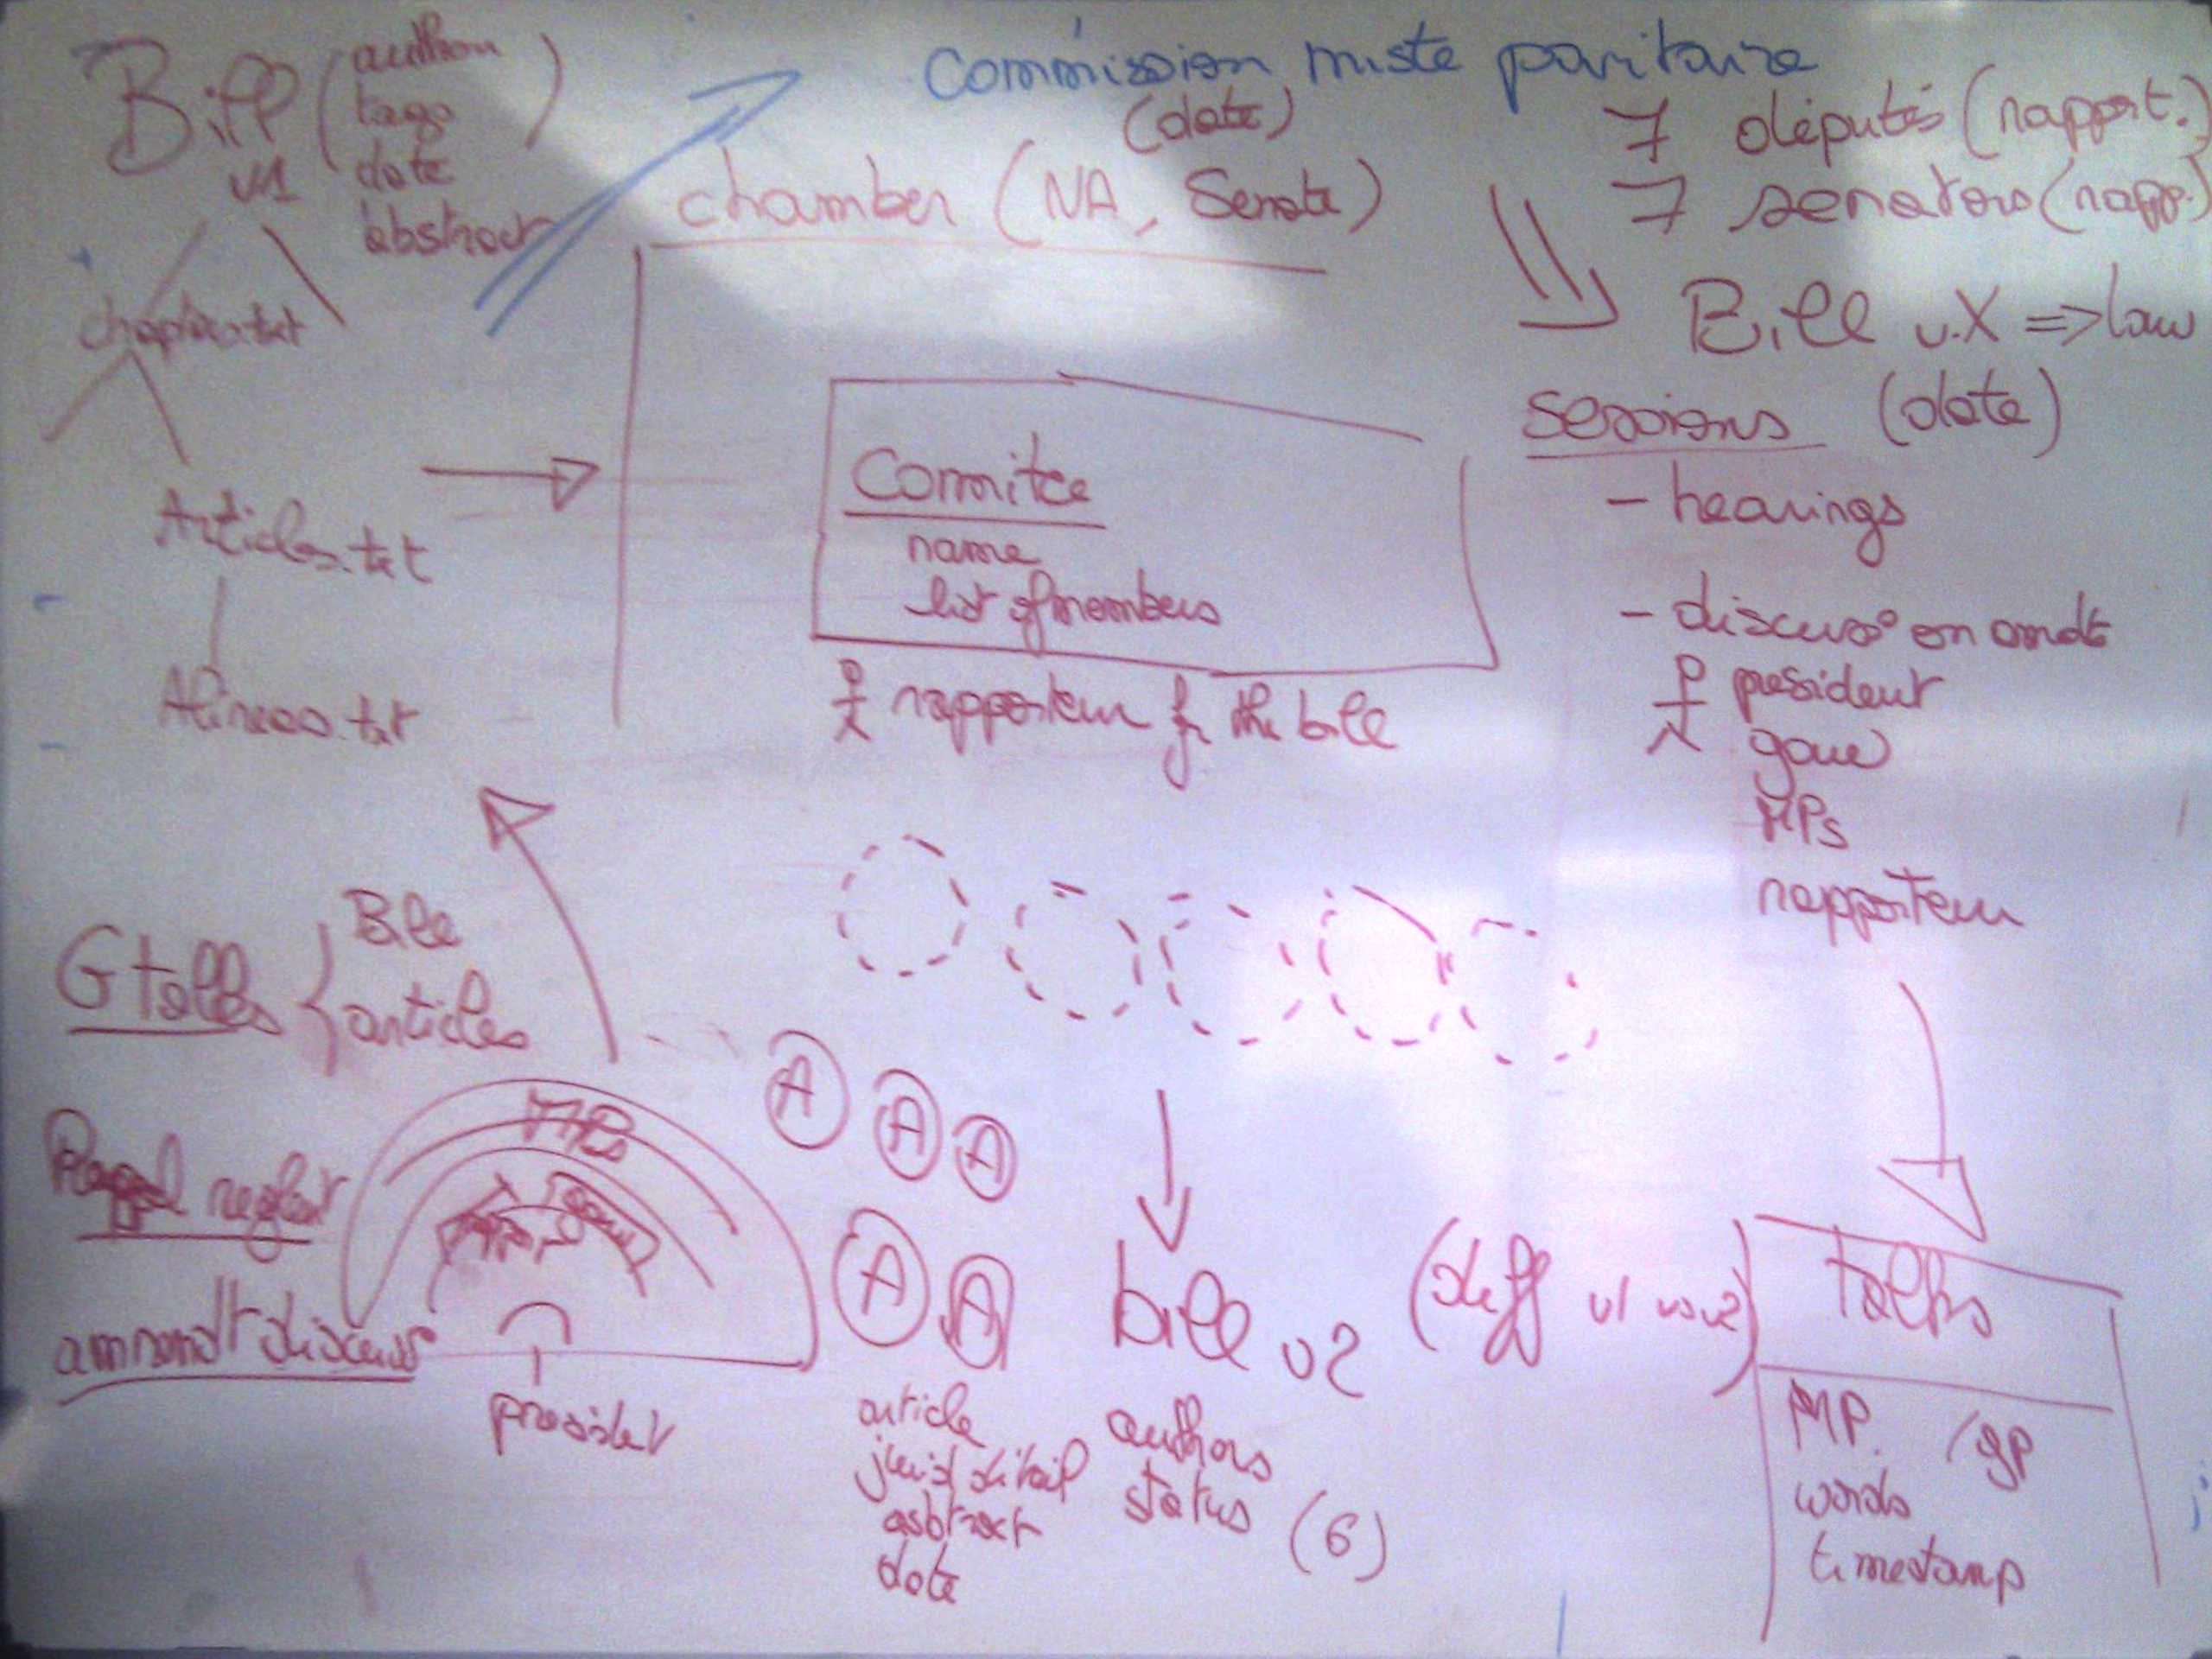
Thus, considering the availability of the data and the research objectives a representation by level of zooms was proposed as follows:
| Floor | Committee | CMP | |
| Diff
Meetings (level 0) |
X | X | X |
| Discussion linked
(level 1) |
X | X | |
| Amendments
(level 2) |
X |